Technical Analysis Strategies for Bolivian Traders

Introduction to Technical Analysis Strategies


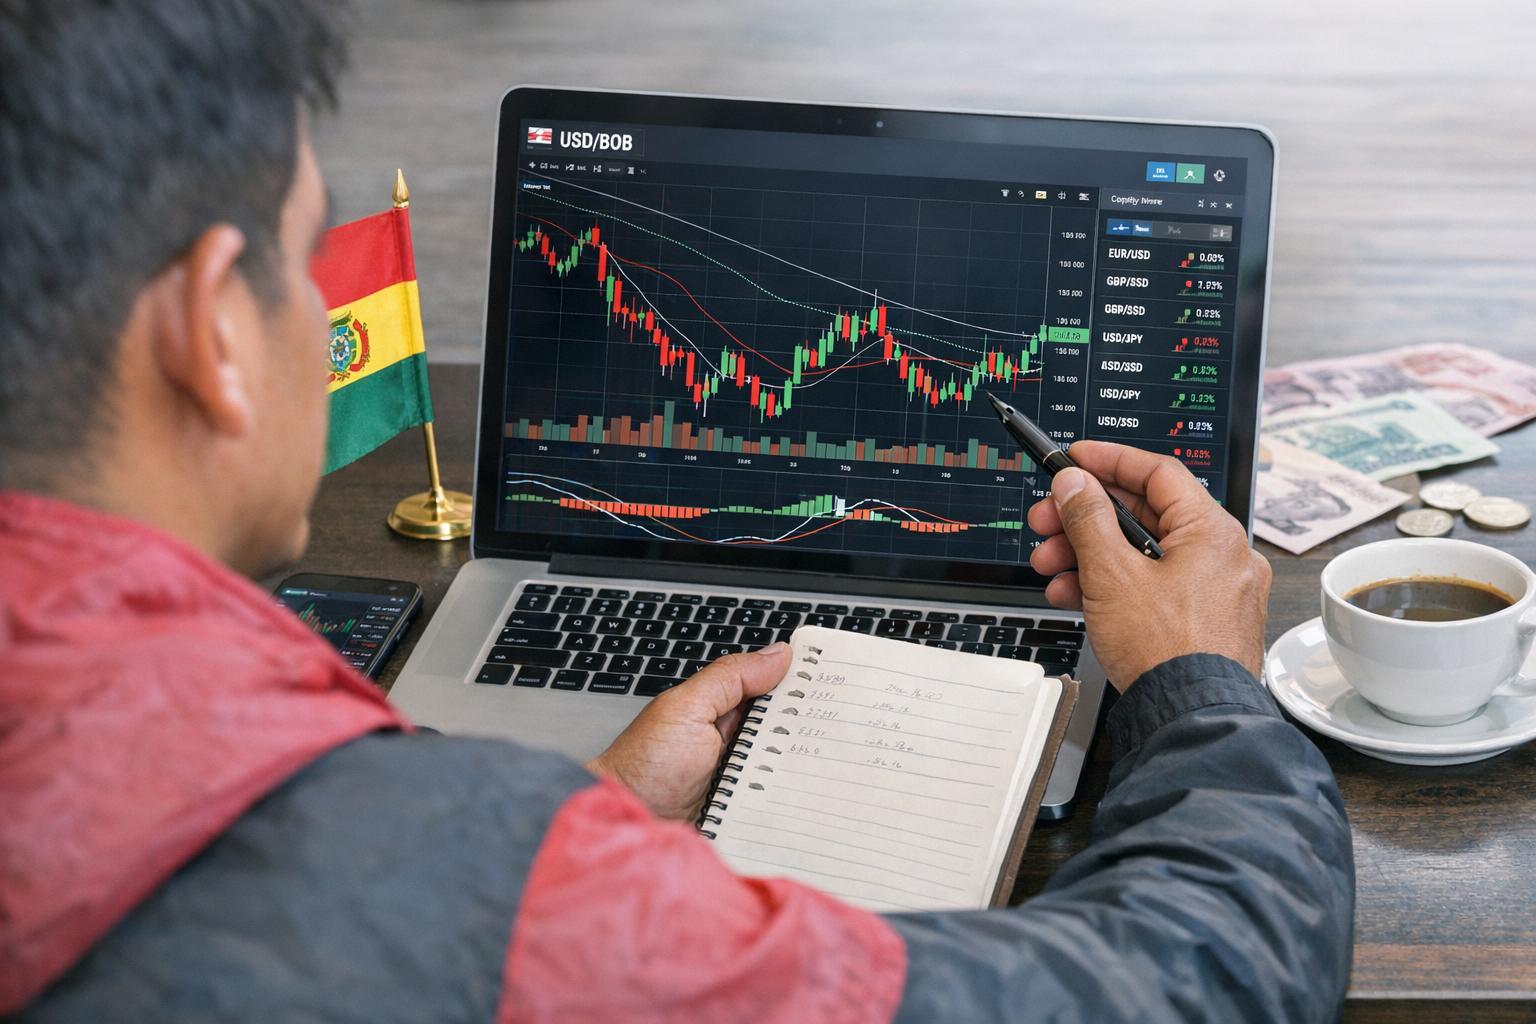
Technical analysis is a method of evaluating financial markets by studying price movements, trading volume, and historical patterns. Rather than focusing on fundamental factors such as economic indicators or company financials, this approach emphasizes observable market behavior. For traders operating in Bolivia, where access to global markets has increased through digital platforms, technical analysis provides a structured way to interpret price action across asset classes such as foreign exchange, equities, cryptocurrencies, and commodities.
The fundamental premise of technical analysis is that all known information is already reflected in price. As a result, patterns repeat over time because market participants tend to react in similar ways under comparable conditions. By identifying these recurring patterns and signals, traders can estimate the probability of future price movements. While no method guarantees success, consistent application of well-established strategies can improve decision-making and risk management.
Understanding Candlestick Patterns
Candlestick charts are one of the most widely used visualization tools in technical analysis. Each candlestick represents price activity over a defined time interval, such as one minute, one hour, or one day. The structure of a candlestick includes the opening price, closing price, highest point, and lowest point within that period. The body and wicks of the candle convey important information about market sentiment.
Several candlestick formations are considered particularly useful for identifying potential trend reversals or continuations. The Hammer pattern, for example, appears after a decline and suggests that buyers are beginning to regain control. It is characterized by a small body and a long lower wick, indicating rejection of lower prices.
The Doji pattern reflects indecision in the market, where the opening and closing prices are very close. This formation often appears at turning points, signaling a potential pause or reversal. However, it requires confirmation through subsequent price action.
The Engulfing pattern consists of two candles, where the second completely engulfs the body of the first. A bullish engulfing pattern may suggest upward momentum, while a bearish engulfing pattern can indicate downward pressure. For traders in Bolivia, these patterns can be applied across various timeframes and assets, offering flexibility depending on trading style.
It is important to interpret candlestick patterns within context. A single pattern rarely provides sufficient evidence for a trade. Instead, combining patterns with other indicators strengthens analytical accuracy.
Moving Averages as Trend Indicators
Moving averages are essential tools for identifying the direction and strength of a trend. By averaging price data over a specified number of periods, they reduce short-term fluctuations and highlight the broader trend. Two common types are the Simple Moving Average (SMA) and the Exponential Moving Average (EMA). The primary difference lies in weighting; EMAs assign more importance to recent data, making them more responsive to current price changes.
Traders often use multiple moving averages simultaneously to gain deeper insight. For example, pairing a short-term average with a long-term average can reveal changes in momentum. When the shorter average crosses above the longer one, this is known as a Golden Cross, which may indicate the beginning of an upward trend. Conversely, a Death Cross occurs when the short-term average crosses below the long-term average, suggesting potential downward movement.
In addition to crossover signals, moving averages can act as dynamic support and resistance levels. Prices often react around these lines, creating opportunities for entry or exit. For Bolivian traders who may be managing trades in volatile global markets, moving averages provide a structured and easily interpretable framework.
However, moving averages are lagging indicators, meaning they rely on past data. As a result, signals may appear after a trend has already begun. Combining them with leading indicators can help mitigate this limitation.
Relative Strength Index (RSI)
The Relative Strength Index (RSI) is a momentum oscillator designed to measure the speed and magnitude of price changes. It operates on a scale from 0 to 100 and is typically used to identify whether an asset is overbought or oversold. An RSI value above 70 is commonly interpreted as overbought, while a value below 30 suggests oversold conditions.
For traders in Bolivia, RSI can serve multiple purposes. Beyond identifying extreme conditions, it can also help confirm trends. During strong upward trends, RSI may remain above 50 for extended periods, indicating sustained buying pressure. In downtrends, it may stay below 50, reflecting persistent selling activity.
Divergence is another important concept associated with RSI. This occurs when the price moves in one direction while the RSI moves in the opposite direction. For instance, if prices reach higher highs but RSI forms lower highs, it may indicate weakening momentum and a potential reversal. Although divergence does not guarantee an immediate change in direction, it provides early insight into possible shifts.
RSI is most effective when used alongside other indicators or price patterns. Relying solely on overbought or oversold signals can lead to premature entries, especially in strongly trending markets.
Bollinger Bands for Volatility Measurement
Bollinger Bands are designed to measure market volatility and identify potential price extremes. The indicator consists of three components: a middle band, typically a simple moving average, and two outer bands set at a specified number of standard deviations above and below the middle line. These outer bands expand and contract based on market volatility.
When volatility increases, the bands widen, indicating larger price movements. When volatility decreases, the bands narrow, signaling consolidation. This dynamic behavior makes Bollinger Bands useful for anticipating potential breakouts. Periods of low volatility are often followed by significant price moves, a concept sometimes referred to as “volatility compression.”
Traders may also interpret price interactions with the bands as signals. For example, when the price touches or moves outside the upper band, it may indicate overbought conditions, while contact with the lower band may suggest oversold conditions. However, these signals are not inherently reversal indicators; in strong trends, prices can remain near one band for extended periods.
For Bolivian traders engaging with global markets, Bollinger Bands provide a way to assess both trend conditions and the likelihood of sudden price changes. Combining them with tools such as RSI or MACD can enhance signal reliability.
MACD: A Comprehensive Trend-Following Tool
The Moving Average Convergence Divergence (MACD) is a widely used indicator that combines trend-following and momentum analysis. It consists of the MACD line, the signal line, and a histogram representing the difference between the two. The MACD line is derived from the difference between two exponential moving averages, while the signal line is an EMA of the MACD line itself.
One of the primary uses of MACD is identifying crossovers. When the MACD line crosses above the signal line, it may indicate increasing upward momentum and a potential buying opportunity. When it crosses below, it may suggest downward momentum and a possible selling signal. These crossovers are often used in conjunction with overall trend analysis to avoid false signals.
The histogram provides additional insight into momentum strength. Expanding bars indicate increasing momentum, while contracting bars suggest weakening momentum. Observing these changes can help traders anticipate shifts in price direction before they become evident on the chart.
Divergence also plays a role in MACD analysis. Similar to RSI, divergence between MACD and price can signal a potential reversal. For example, if prices make new highs while MACD fails to do so, it may indicate a loss of upward momentum.
MACD is particularly valuable for traders who prefer a structured and systematic approach. Its combination of trend and momentum elements makes it adaptable across different markets and timeframes.
Combining Indicators for Stronger Analysis
While each technical indicator provides useful information, relying on a single tool can lead to incomplete analysis. Combining multiple indicators allows traders to confirm signals and reduce the likelihood of false interpretations. For example, a trader might use moving averages to identify the overall trend, RSI to assess momentum, and candlestick patterns to refine entry points.
It is important to ensure that indicators used together provide complementary information rather than redundant signals. Using several indicators that measure the same aspect of the market can create unnecessary complexity without improving accuracy. A balanced approach typically includes one indicator for trend, one for momentum, and one for volatility.
For traders in Bolivia, this integrated method can be particularly useful when navigating international markets that may exhibit different levels of volatility and liquidity. A consistent analytical framework helps maintain discipline and reduces reliance on subjective judgment.
Timeframes and Market Context
Technical analysis can be applied across multiple timeframes, from short-term intraday charts to long-term weekly or monthly views. The choice of timeframe depends on the trader’s objectives, available time, and risk tolerance. Shorter timeframes offer more frequent opportunities but require close monitoring, while longer timeframes provide broader trends with fewer signals.
Aligning multiple timeframes is a common practice. For instance, a trader may analyze a daily chart to determine the overall trend and then use a shorter timeframe, such as an hourly chart, to identify precise entry points. This approach helps ensure that trades are aligned with the dominant market direction.
Market context is also important. Economic events, geopolitical developments, and changes in liquidity can influence price behavior. While technical analysis focuses on price data, understanding the broader environment can help interpret signals more effectively.
Risk Management Considerations
Technical analysis strategies are most effective when combined with proper risk management. Even well-validated setups can result in losses due to unpredictable market conditions. Establishing clear rules for position sizing, stop-loss placement, and profit targets is essential.
Stop-loss orders are particularly important, as they define the maximum acceptable loss for a trade. These can be placed based on technical levels, such as support and resistance, or calculated as a percentage of account capital. Maintaining consistent risk parameters helps preserve capital over the long term.
Traders should also avoid overtrading, which can result from reacting to every minor signal. A disciplined approach that prioritizes high-quality setups contributes to more stable performance. For Bolivian traders accessing global markets, where volatility can vary significantly, maintaining these practices is crucial.
Final Thoughts
Technical analysis provides a structured framework for interpreting market behavior and identifying potential trading opportunities. By understanding tools such as candlestick patterns, moving averages, RSI, Bollinger Bands, and MACD, traders can develop a more systematic approach to decision-making. Each indicator offers a different perspective, and their combined use can enhance analytical depth.
For traders in Bolivia, the increasing availability of digital trading platforms has expanded access to international markets. Applying technical analysis within a disciplined and well-managed framework can support more consistent outcomes. While no strategy guarantees success, ongoing learning, careful observation, and prudent risk management remain central to effective trading practice.
This article was last updated on: April 10, 2026