How to Read Forex Charts: A Guide for Bolivians
Introduction to Forex Charts


Forex charts are a primary interface through which traders observe and interpret the behavior of currency pairs. These charts translate large volumes of transactional data into visual formats that can be studied over different time horizons. For traders operating in Bolivia, where participation in global financial markets is increasing, the ability to read Forex charts with precision is a practical requirement rather than a theoretical skill.
At their core, Forex charts display how one currency is valued against another across time. Each price movement reflects a combination of economic data, geopolitical developments, interest rate expectations, and market sentiment. Without charts, this information would remain abstract and difficult to interpret. By organizing price action visually, charts allow traders to identify recurring structures, directional bias, and areas of significant price interaction.
In Bolivia, where access to international markets often occurs through digital trading platforms, charts become the main analytical tool. Mastery involves not only recognizing basic shapes but also understanding the context in which those movements occur.
Basic Components of Forex Charts
Forex charts share several standard components regardless of the platform being used. These elements structure how price data is displayed and interpreted.
Time Frame
The time frame determines how much data each point or bar on the chart represents. A one-minute chart shows rapid fluctuations and is typically used for short-term trading strategies such as scalping. In contrast, daily or weekly charts present broader trends that are more relevant to long-term investors.
Choosing the appropriate time frame is not arbitrary. Shorter time frames contain more noise, meaning random or insignificant price movements can obscure meaningful trends. Longer time frames filter out this noise but may delay entry or exit decisions. Traders in Bolivia who are balancing trading with other professional activities often favor higher time frames for clearer signals and reduced monitoring requirements.
Price Representation
The way prices are visually represented affects how easily a trader can interpret market information. The three most common chart types are line charts, bar charts, and candlestick charts.
Line Charts
Line charts connect closing prices over a selected period into a continuous line. This representation removes intra-period volatility and focuses solely on final price outcomes. As a result, line charts are often used for identifying general trends without distraction from minor fluctuations.
However, the simplicity of line charts also limits their usefulness. They do not display the range of price movement within each period, which can be important for understanding volatility and market behavior. For this reason, they are generally used as a preliminary analytical tool rather than a primary one.
Bar Charts
Bar charts provide more detailed information by displaying opening, high, low, and closing prices for each period. Each bar consists of a vertical line representing the full price range and horizontal ticks indicating the opening and closing prices.
This format allows traders to observe volatility and price rejection levels more clearly. For example, a long vertical bar indicates significant movement within a period, while the position of the closing price relative to the range can suggest bullish or bearish pressure.
Despite their informational richness, bar charts can appear complex, especially when viewed over longer periods with many bars. This has led many traders to prefer candlestick charts for their clarity.
Candlestick Charts
Candlestick charts present the same data as bar charts but in a more visually intuitive format. Each candlestick consists of a body and wicks. The body represents the range between opening and closing prices, while the wicks show the highest and lowest prices during the period.
Color coding distinguishes whether the price increased or decreased. Typically, a green or white candle indicates a closing price above the opening price, while a red or black candle indicates the opposite.
Candlestick charts are widely used because they make patterns and sentiment shifts easier to identify. Specific formations, such as engulfing patterns or doji candles, can signal potential reversals or continuations in the market.
Understanding Price Behavior and Market Structure
Reading Forex charts is not limited to recognizing chart types. It involves analyzing how prices move and interact with certain levels. Two central concepts in this process are trends and support and resistance.
Trends
A trend represents the general direction of the market over a period of time. An upward trend is characterized by higher highs and higher lows, while a downward trend consists of lower highs and lower lows. When neither condition is present, the market is considered to be in a range.
Identifying trends helps traders align their positions with the dominant market direction. Trading against the trend introduces additional risk, particularly for less experienced participants.
Support and Resistance
Support levels are price areas where downward movement tends to slow or reverse, while resistance levels are areas where upward movement faces pressure. These levels form due to repeated interactions between buyers and sellers at specific prices.
On a chart, support and resistance levels can often be identified by observing where price has reversed multiple times. These zones are not exact numbers but rather ranges where market activity tends to concentrate.
For Bolivian traders working with currency pairs that may exhibit varying liquidity, recognizing these levels is particularly important for managing entry and exit points.
Understanding Forex Chart Indicators
Indicators are mathematical calculations applied to price data to assist in analysis. While they do not predict the future with certainty, they provide structured ways to interpret historical data.
Moving Averages
Moving averages smooth price data by calculating the average price over a specified number of periods. This smoothing effect helps reduce short-term fluctuations and highlights the overall trend.
The Simple Moving Average (SMA) calculates the average by giving equal weight to all data points in the period. The Exponential Moving Average (EMA) places more emphasis on recent prices, making it more responsive to current market conditions.
Moving averages are often used to identify trend direction and potential crossover signals. For example, when a shorter-term average crosses above a longer-term average, it may indicate upward momentum.
Relative Strength Index (RSI)
The RSI measures the speed and magnitude of price movements on a scale from 0 to 100. Values above 70 are generally interpreted as overbought conditions, while values below 30 indicate oversold conditions.
While these thresholds can suggest potential reversals, they should not be used in isolation. In strong trends, the RSI can remain in overbought or oversold territory for extended periods.
Bollinger Bands
Bollinger Bands consist of a moving average with two outer bands that expand and contract based on volatility. When the bands widen, it indicates increased volatility; when they narrow, it suggests reduced market activity.
Prices touching the outer bands may signal potential reversal points, but this depends on broader market context. In trending markets, prices can remain near one band for prolonged periods.
Combining Indicators with Price Action
Indicators are most effective when used alongside direct observation of price movement. Relying solely on indicators can lead to conflicting signals, particularly when multiple tools are applied simultaneously.
A more effective approach is to begin with price action—observing trends, levels, and patterns—and then use indicators to confirm or refine those observations. For example, a trader may identify an upward trend through higher highs and then use a moving average to confirm overall direction.
This approach reduces dependency on any single method and encourages a more balanced analysis.
Steps to Analyze a Forex Chart
A structured method of analysis helps traders maintain consistency and avoid impulsive decisions.
Identify the Currency Pair
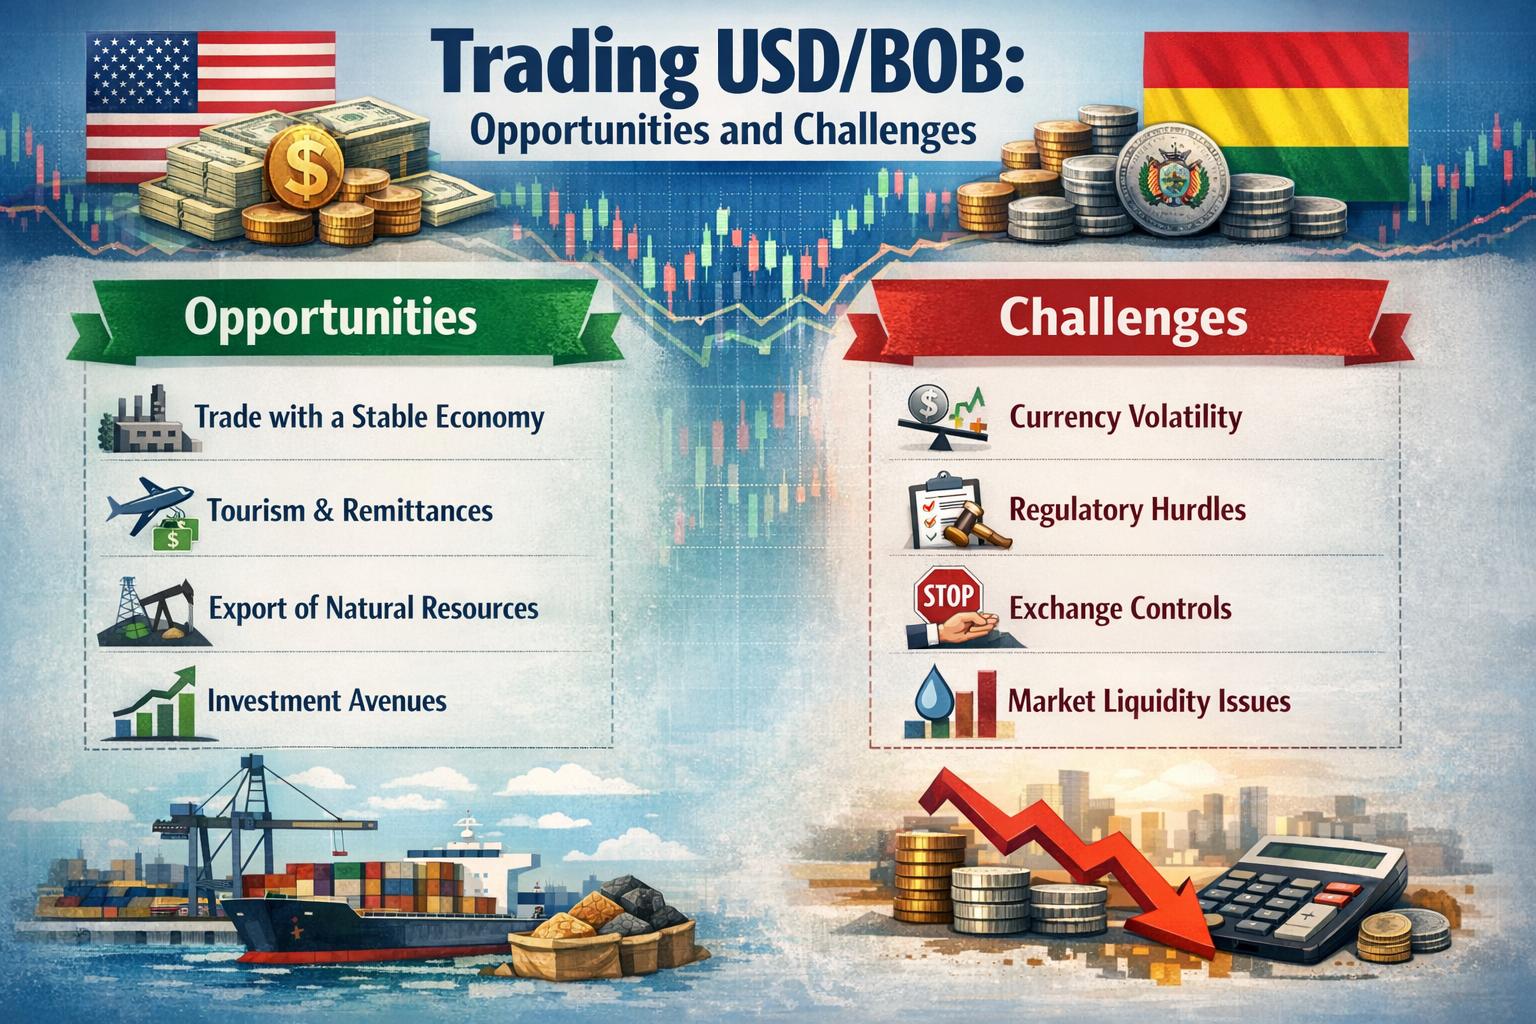
Each currency pair behaves differently based on economic conditions, liquidity, and market participation. While the Bolivian Boliviano is less commonly traded than major currencies, traders may still encounter pairs such as USD/BOB or engage with major pairs like EUR/USD for increased liquidity.
Understanding the characteristics of the selected pair is necessary before analysis begins.
Select Time Frame
The chosen time frame should match the intended duration of the trade. Short-term traders may focus on minute or hourly charts, while long-term participants analyze daily or weekly charts.
Consistency in time frame selection ensures that analysis aligns with trading objectives.
Examine Price Trends
Identifying whether the market is trending or ranging provides a foundation for decision-making. In trending markets, strategies often focus on continuation. In range-bound conditions, traders may look for reversal opportunities at support and resistance levels.
Apply Technical Indicators
Indicators can be used to support observations made from price analysis. Selecting one or two complementary indicators is generally more effective than using many simultaneously.
For instance, combining a trend indicator like a moving average with a momentum indicator such as RSI can provide a more complete view.
Monitor Market News
Charts reflect historical and current price behavior, but they do not explain the underlying causes. Economic releases, central bank decisions, and geopolitical developments can influence currency values significantly.
For Bolivian traders, awareness of both domestic and international economic factors is important, particularly when trading pairs involving major global currencies.
Common Chart Patterns
Certain recurring formations appear on Forex charts, offering insights into potential future movements. These patterns are not guarantees but reflect common market behaviors.
Patterns such as head and shoulders, double tops, and triangles indicate shifts in supply and demand. Recognizing these formations requires practice and should be combined with other analytical tools to improve reliability.
Risk Considerations in Chart Analysis
Chart analysis can improve decision-making, but it does not eliminate risk. Markets can behave unpredictably, and past patterns do not always repeat.
Using stop-loss orders, managing position sizes, and avoiding excessive leverage are essential practices. Chart analysis should be viewed as part of a broader risk management framework rather than a standalone solution.
Practical Application for Bolivian Traders
For traders in Bolivia, access to global Forex markets typically occurs through online platforms provided by international brokers. These platforms offer charting tools with customizable indicators and time frames.
Developing proficiency requires consistent observation and practice. Many traders begin with demo accounts to test strategies without financial risk. Over time, familiarity with charts leads to more efficient analysis and improved decision-making.
Local economic factors, such as inflation, currency policy, and trade balances, can also influence how traders interpret global currency movements. Integrating this knowledge with chart analysis provides a more comprehensive perspective.
Conclusion
Forex charts serve as the primary medium through which traders interpret market activity. Understanding their structure, recognizing patterns, and applying indicators are all components of effective analysis. For Bolivian traders entering or expanding within the Forex market, these skills are essential for navigating price movements and managing risk.
Continuous practice, combined with disciplined analysis, allows traders to refine their approach over time. While no method guarantees success, a structured understanding of charts provides a solid foundation for informed participation in the currency market.
This article was last updated on: April 3, 2026